
Quality & Compliance Case Study
Module: Incident Management
Provider Name: Access Services
Annual Revenue: $45M
Programs: IDD, Behavioral Health, Children & Family, Housing & Homeless Solution
Module: Incident Management

Quality & Compliance Case Study
Module: Incident Management
Provider Name: Access Services
Annual Revenue: $45M
Programs: IDD, Behavioral Health, Children & Family, Housing & Homeless Solution
Module: Incident Management
Saved 20-30 Hours
Eliminated Manual Reporting Efforts
Improved Data-Driven Decision Making
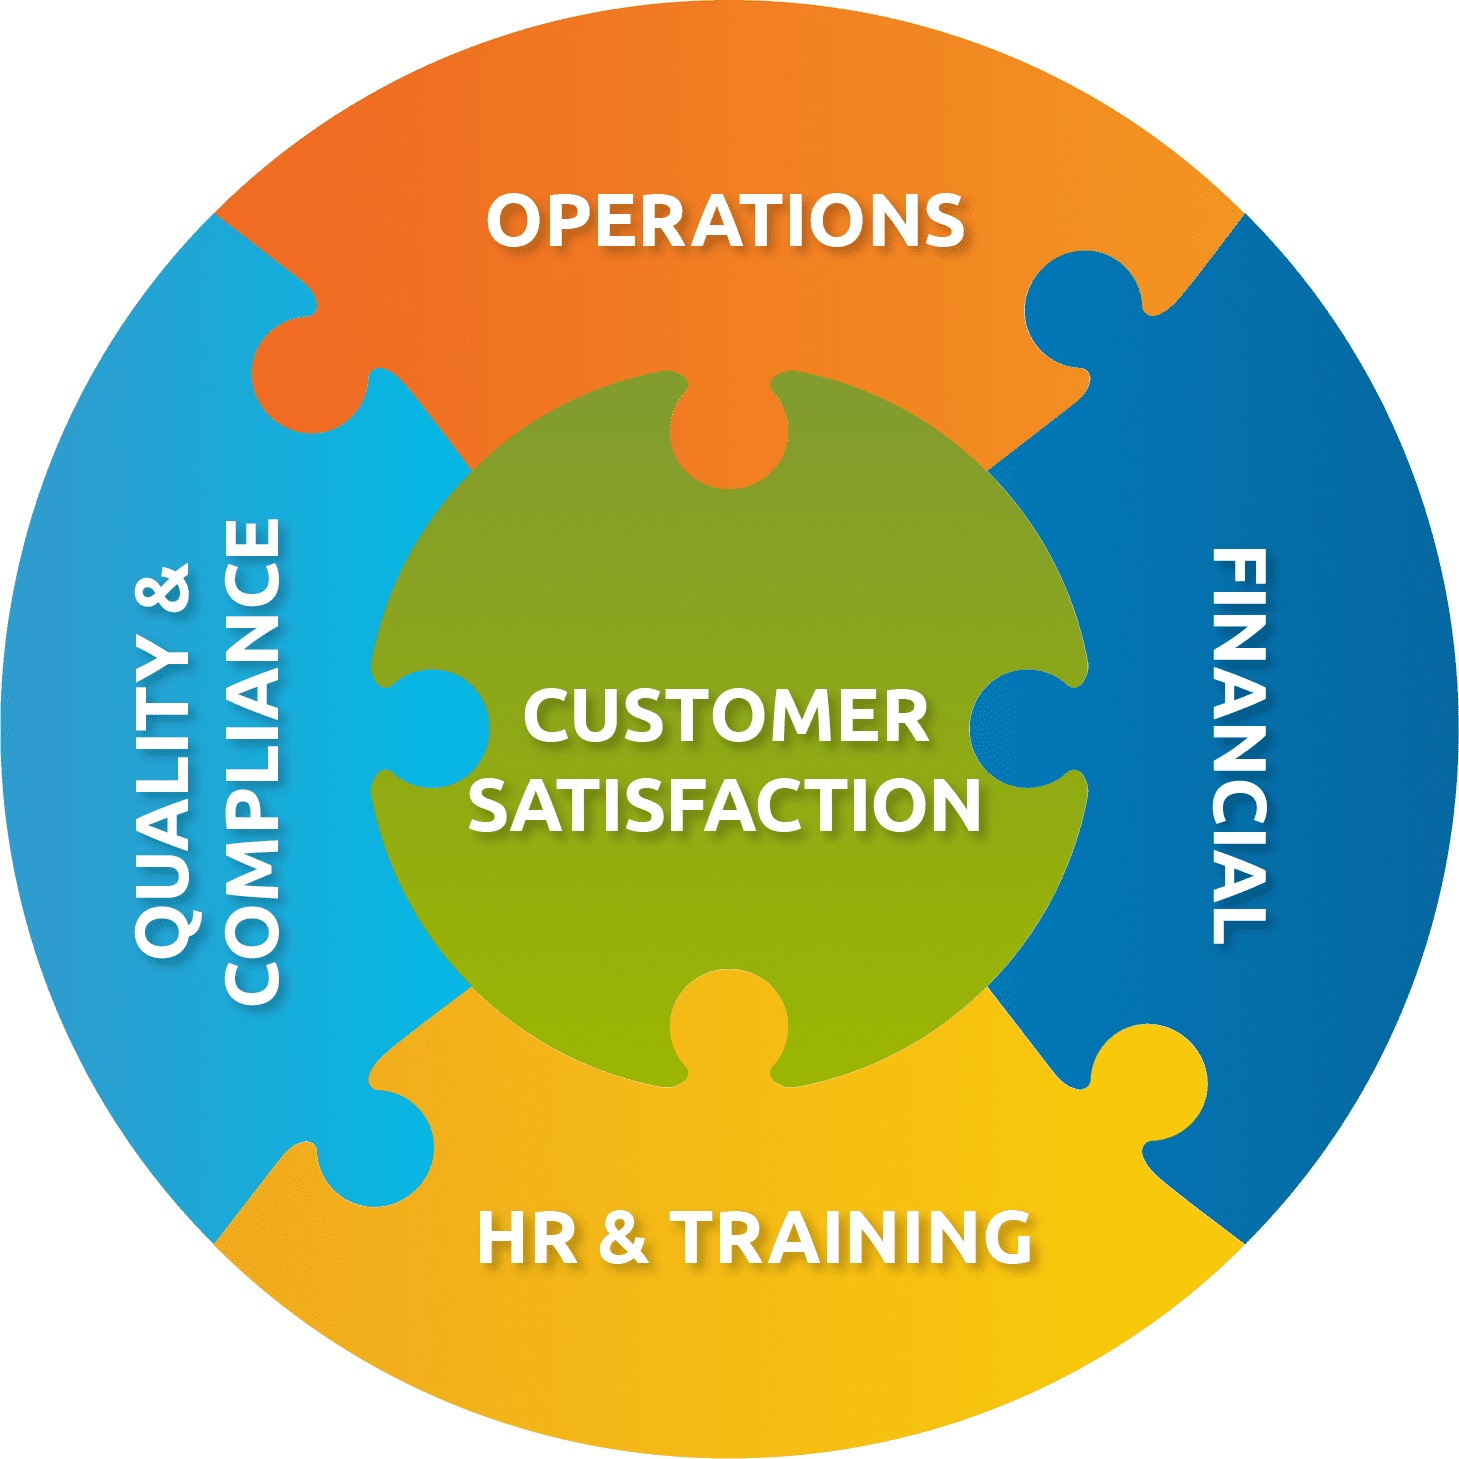
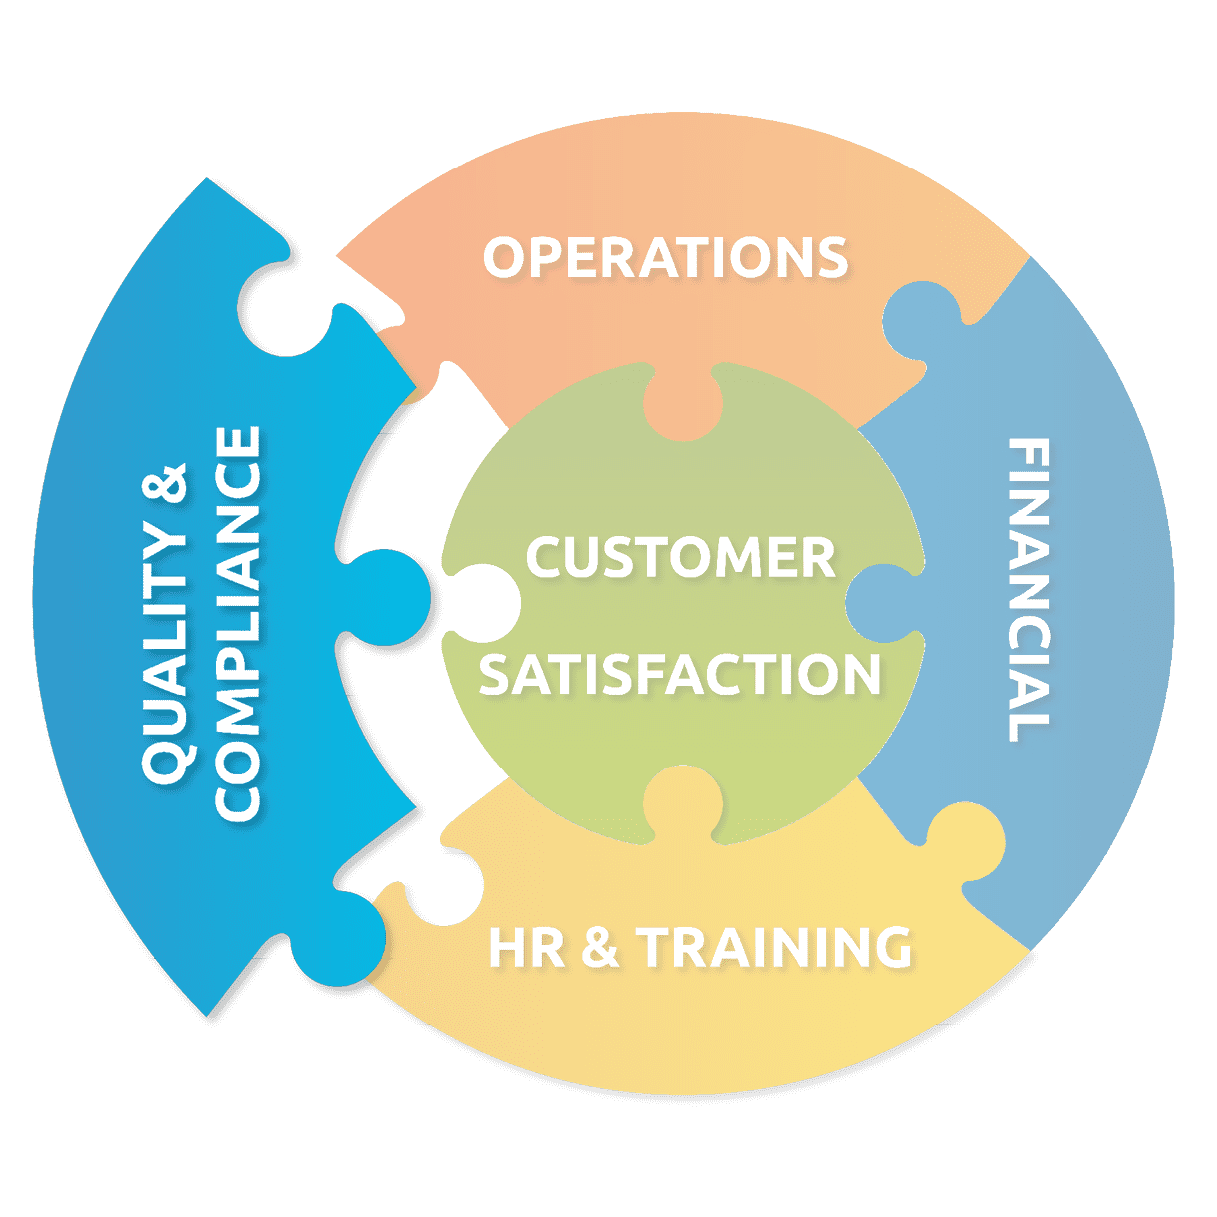
Balanced Scorecard Results
Problems
- Time-consuming
- Manual efforts
- Skewed data
- Little time left for analysis
- Target analysis very difficult
- Program leaders could not easily understand data (number of incidents, categories, frequency, corrective actions and compliance)
Solutions
- Fully automated reporting
- Now working “WITH” the data not “ON” the data
- Visibility into trends/concerns
- Digestible and efficient reporting
- Saved 20-30 hours per quarter
- Maintain compliance
- Ensure quality
“Through the use of the BI modules we’re now more empowered to transform data into action creating opportunities for improved agility, efficiency and decision making while also mitigating risk and optimizing performance.”
Case Studies
Measuring the Impact of Our Business Intelligence Solutions

Saved 10-20 Hours
Fully Automated Reports
Enabled Different Data Analysis

Eliminated Hours of Manual Reporting and Frustration
Enabled Instant Access to Accurate, Regulation-Compliant Incident Reports
Strengthened Data Governance and Decision-Making Power